Stonqs

Portfolio tracker for macOS, Windows and Linux
Your portfolio, measured properly.

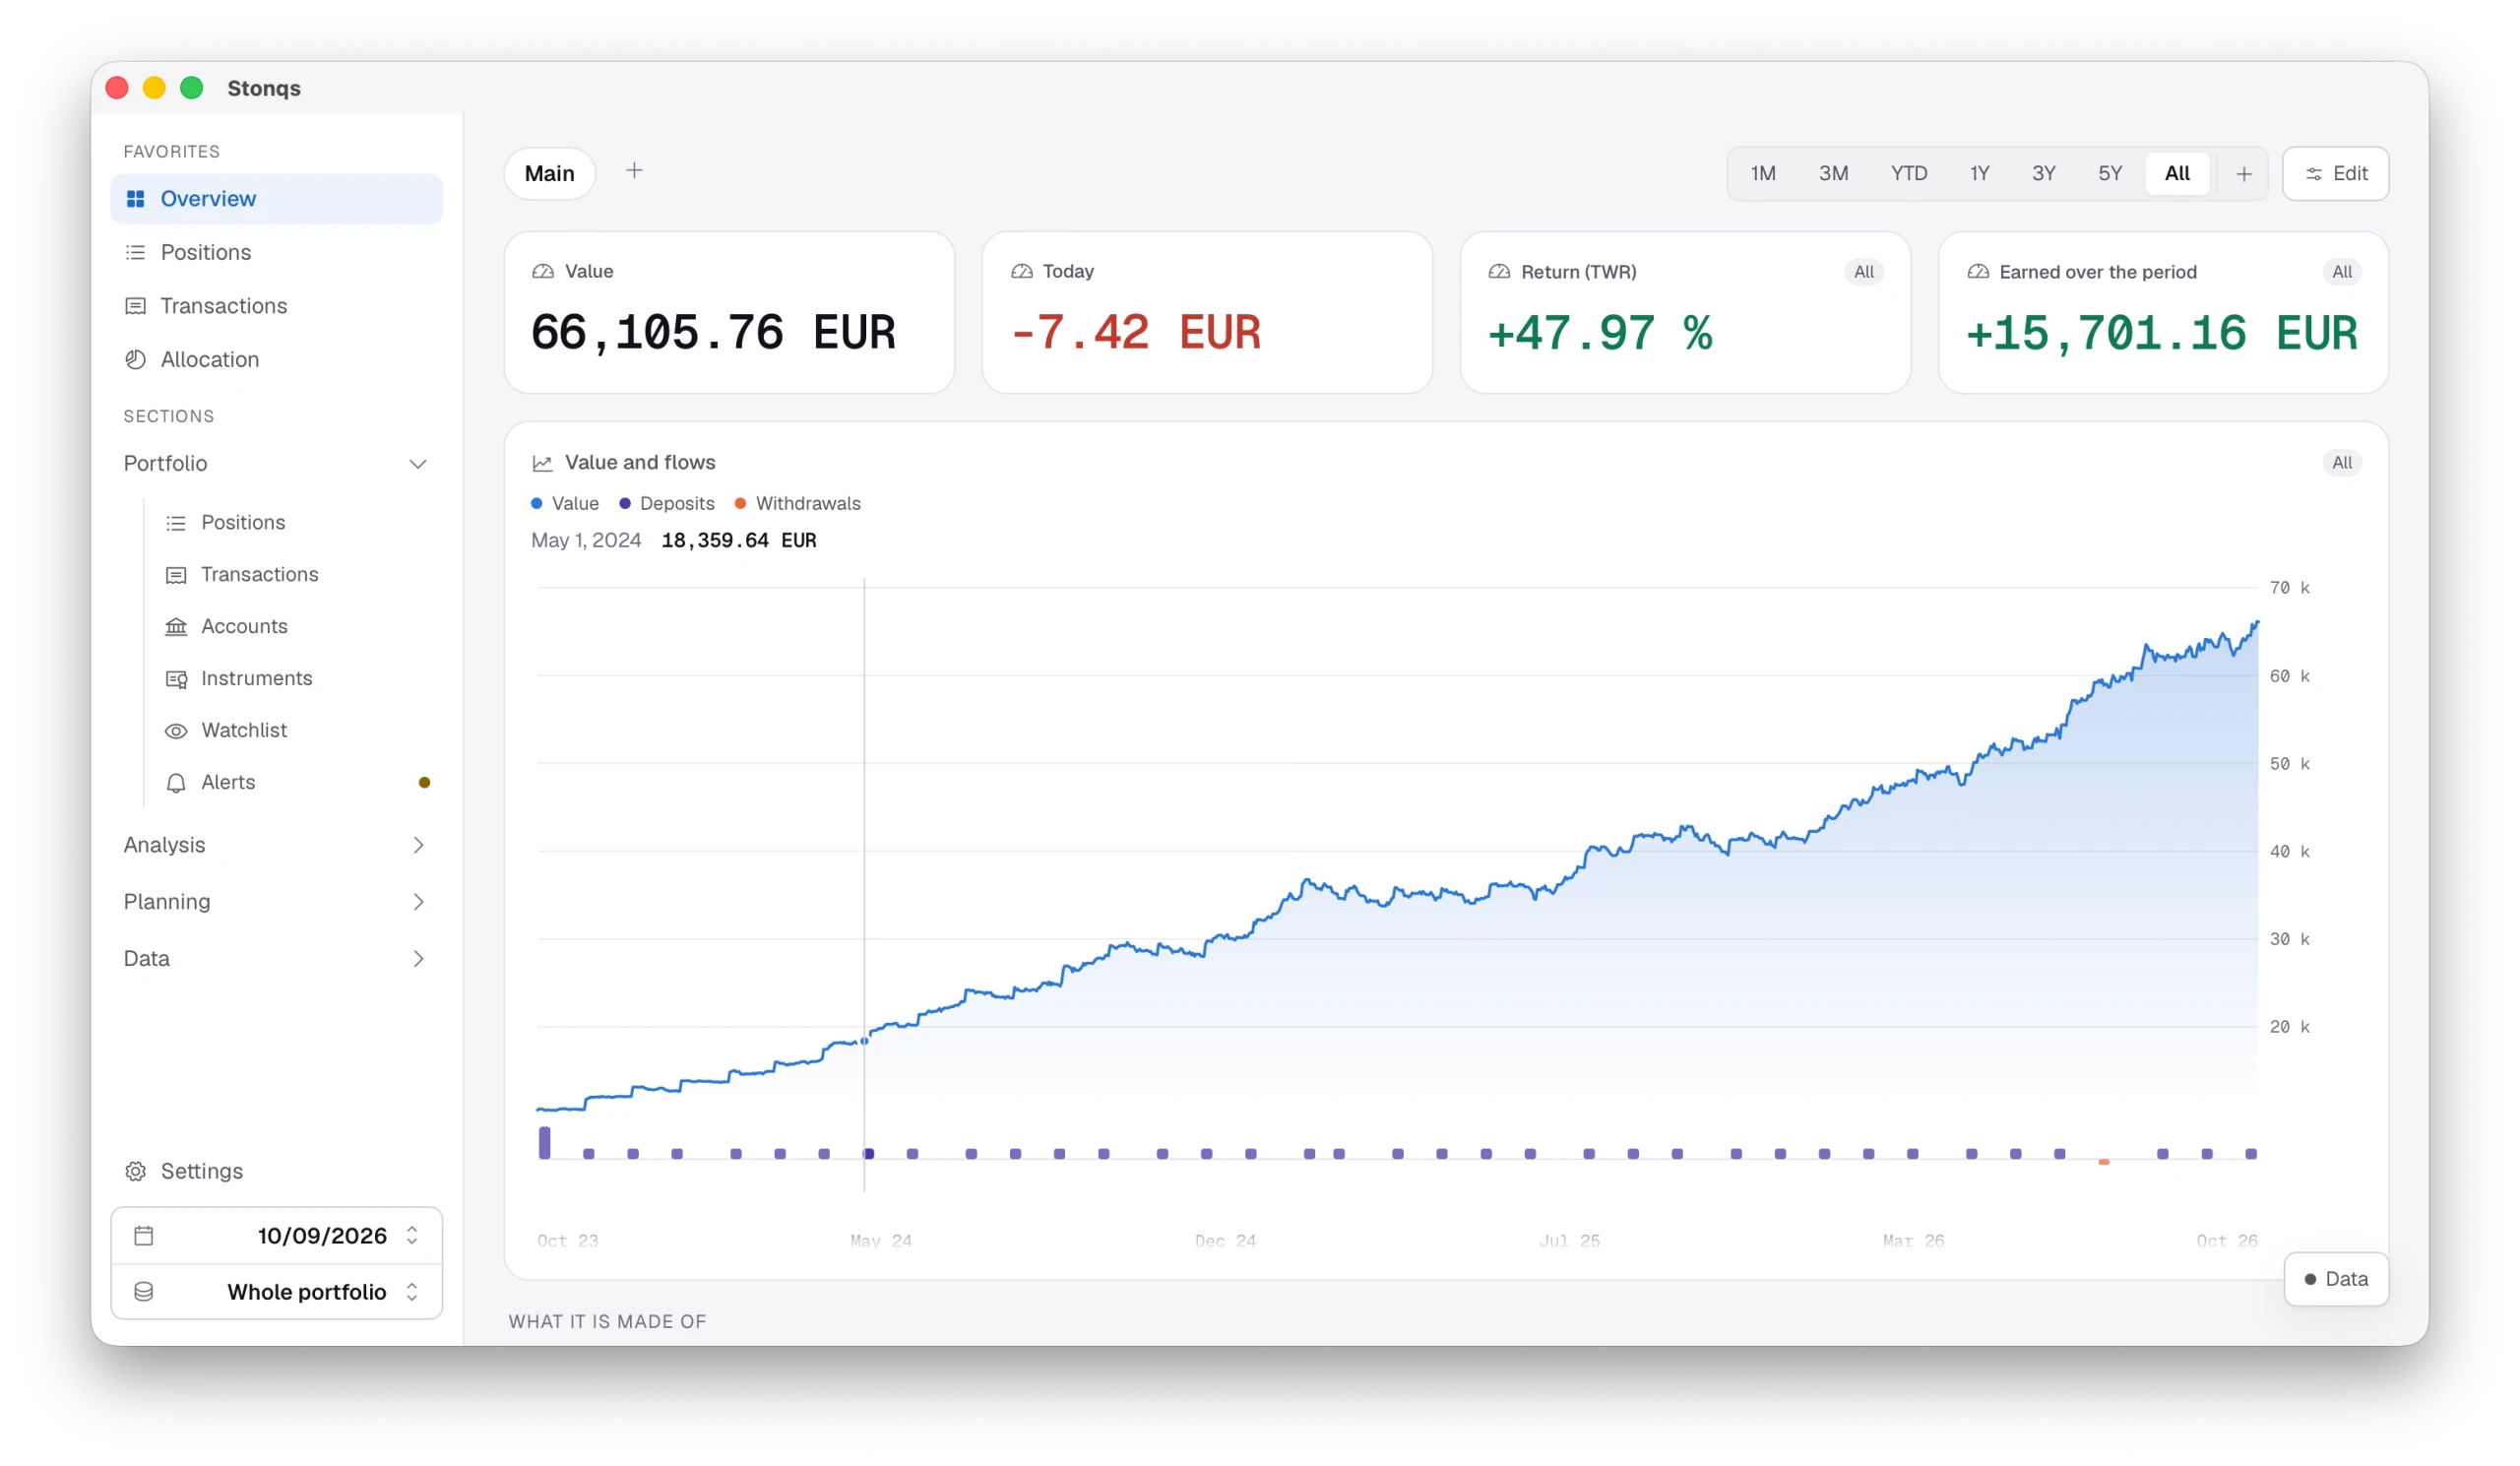
The Overview screen of Stonqs: value 66,105.76 EUR, today −7.42 EUR, time-weighted return +47.97 % and +15,701.16 EUR earned, above a chart of value and deposits from October 2023 to October 2026.
The app on an example portfolio with made-up figures.

Reads exports from 26 brokers as they are. Any other CSV, you map once.

Broker names are trademarks of their owners. Stonqs is not affiliated with or endorsed by any of them.

Two returns, clearly labelled.

An example portfolio, three years

How did my investments do?

+9.1%a year

Time-weighted return

Deposits and withdrawals are taken out, so a big top-up never looks like good performance. This is the number to compare with an index.

How did I do?

+9.0%a year

Money-weighted return

Here your timing counts. Buying before a rally helps, adding just before a fall hurts. Realised gains come from the actual lots each sale used up.

Made-up figures. Both returns are worked out in your browser with the same formulas the app uses, so the chart is a demonstration, not a forecast or advice.

How the two returns are calculated

The detail behind every number.

What Stonqs works out from your broker's exports, panel by panel. Shown on the app's demo portfolio, with made-up figures.

Returns

Holdings

Planning

Returns · Return by month

A good year, or one lucky month?

Each month's time-weighted return and each year's total. Money paid in or out does not count as a gain or a loss.
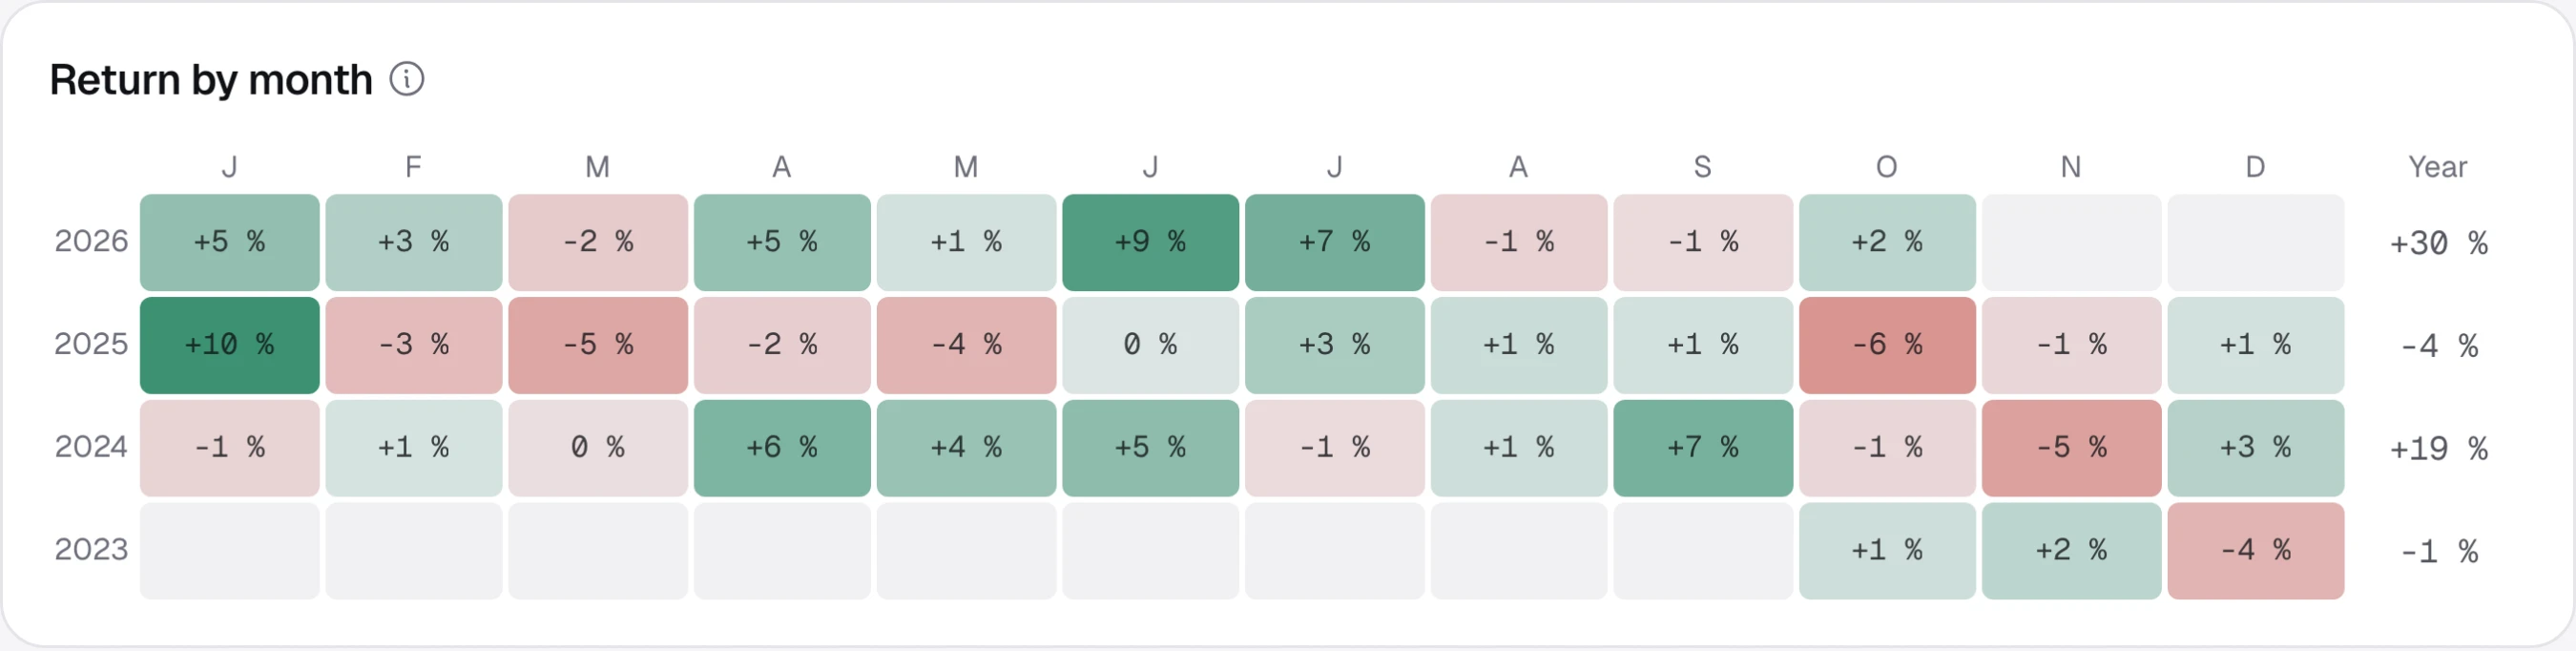
  • Time-weighted return of every month
  • A total for every year
Return by month: a grid of monthly returns from October 2023 to October 2026, coloured green and red, with a total for each year.

Returns · Return by position

Which holdings made the result?

What every instrument earned over the period, and how much of the portfolio's return it accounts for.
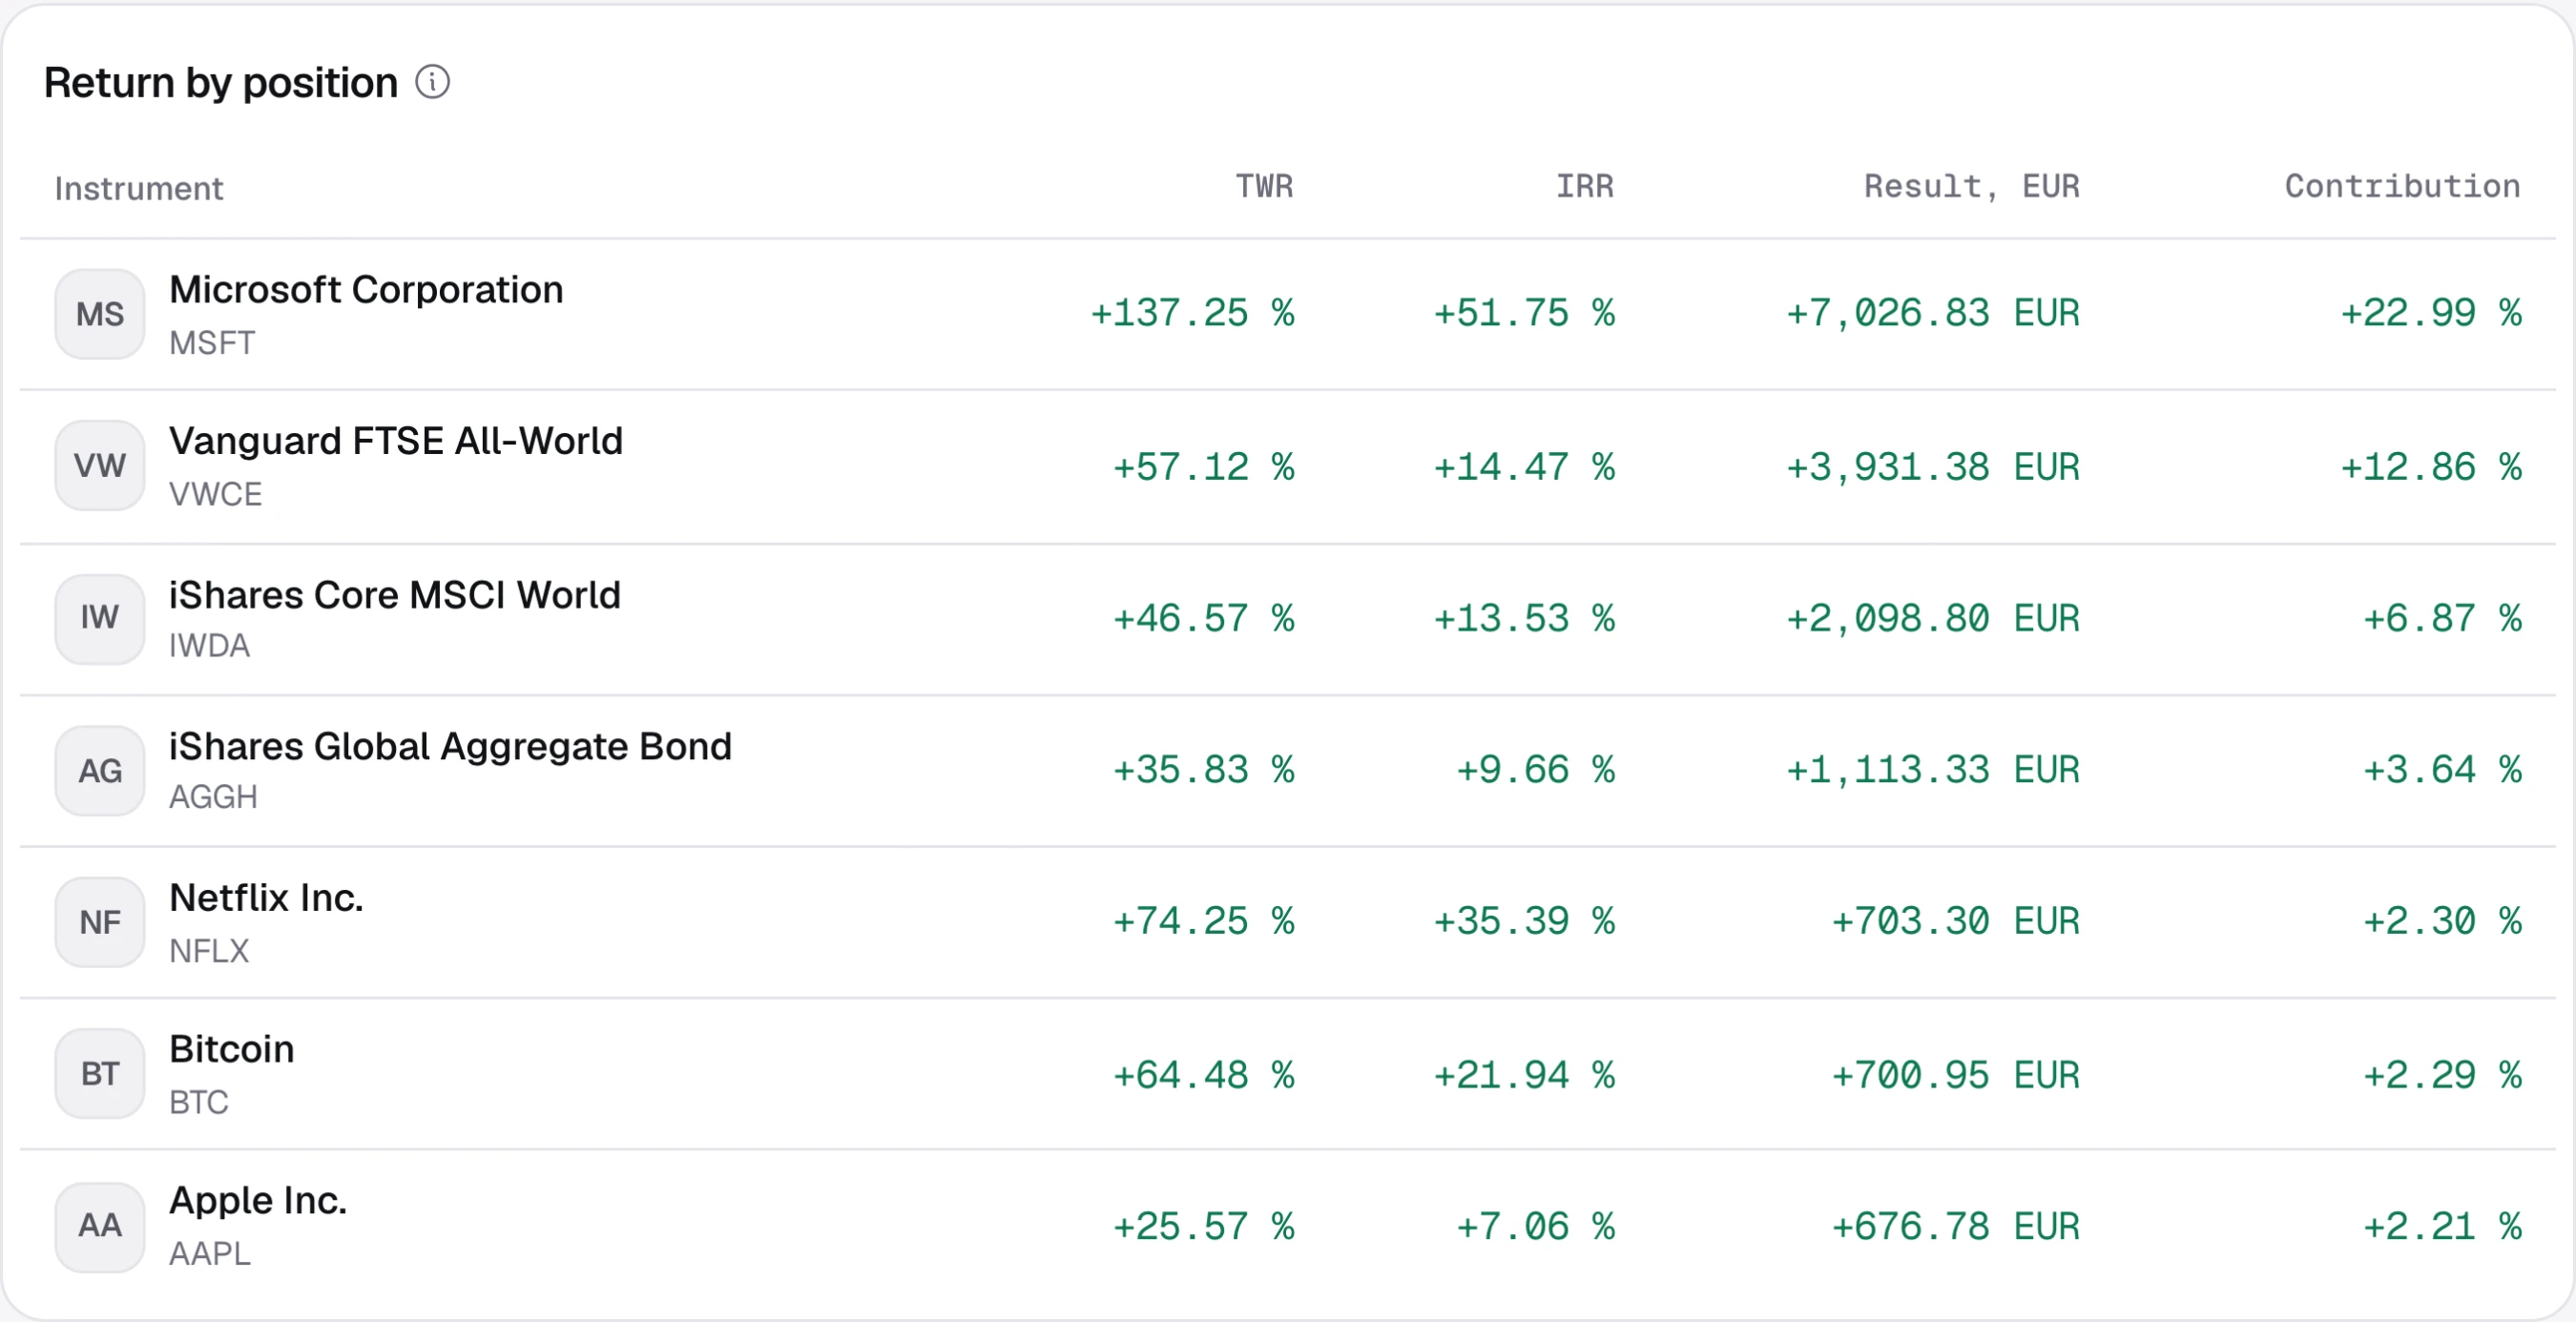
  • Time-weighted return and IRR per instrument
  • Result in your own currency
  • Share of the portfolio's return
Return by position: seven instruments, each with its time-weighted return, IRR, result in EUR and contribution to the portfolio's return; the largest is Microsoft with +7,026.83 EUR, 22.99 % of the return.

Returns · Drawdowns

How far did it fall from the top?

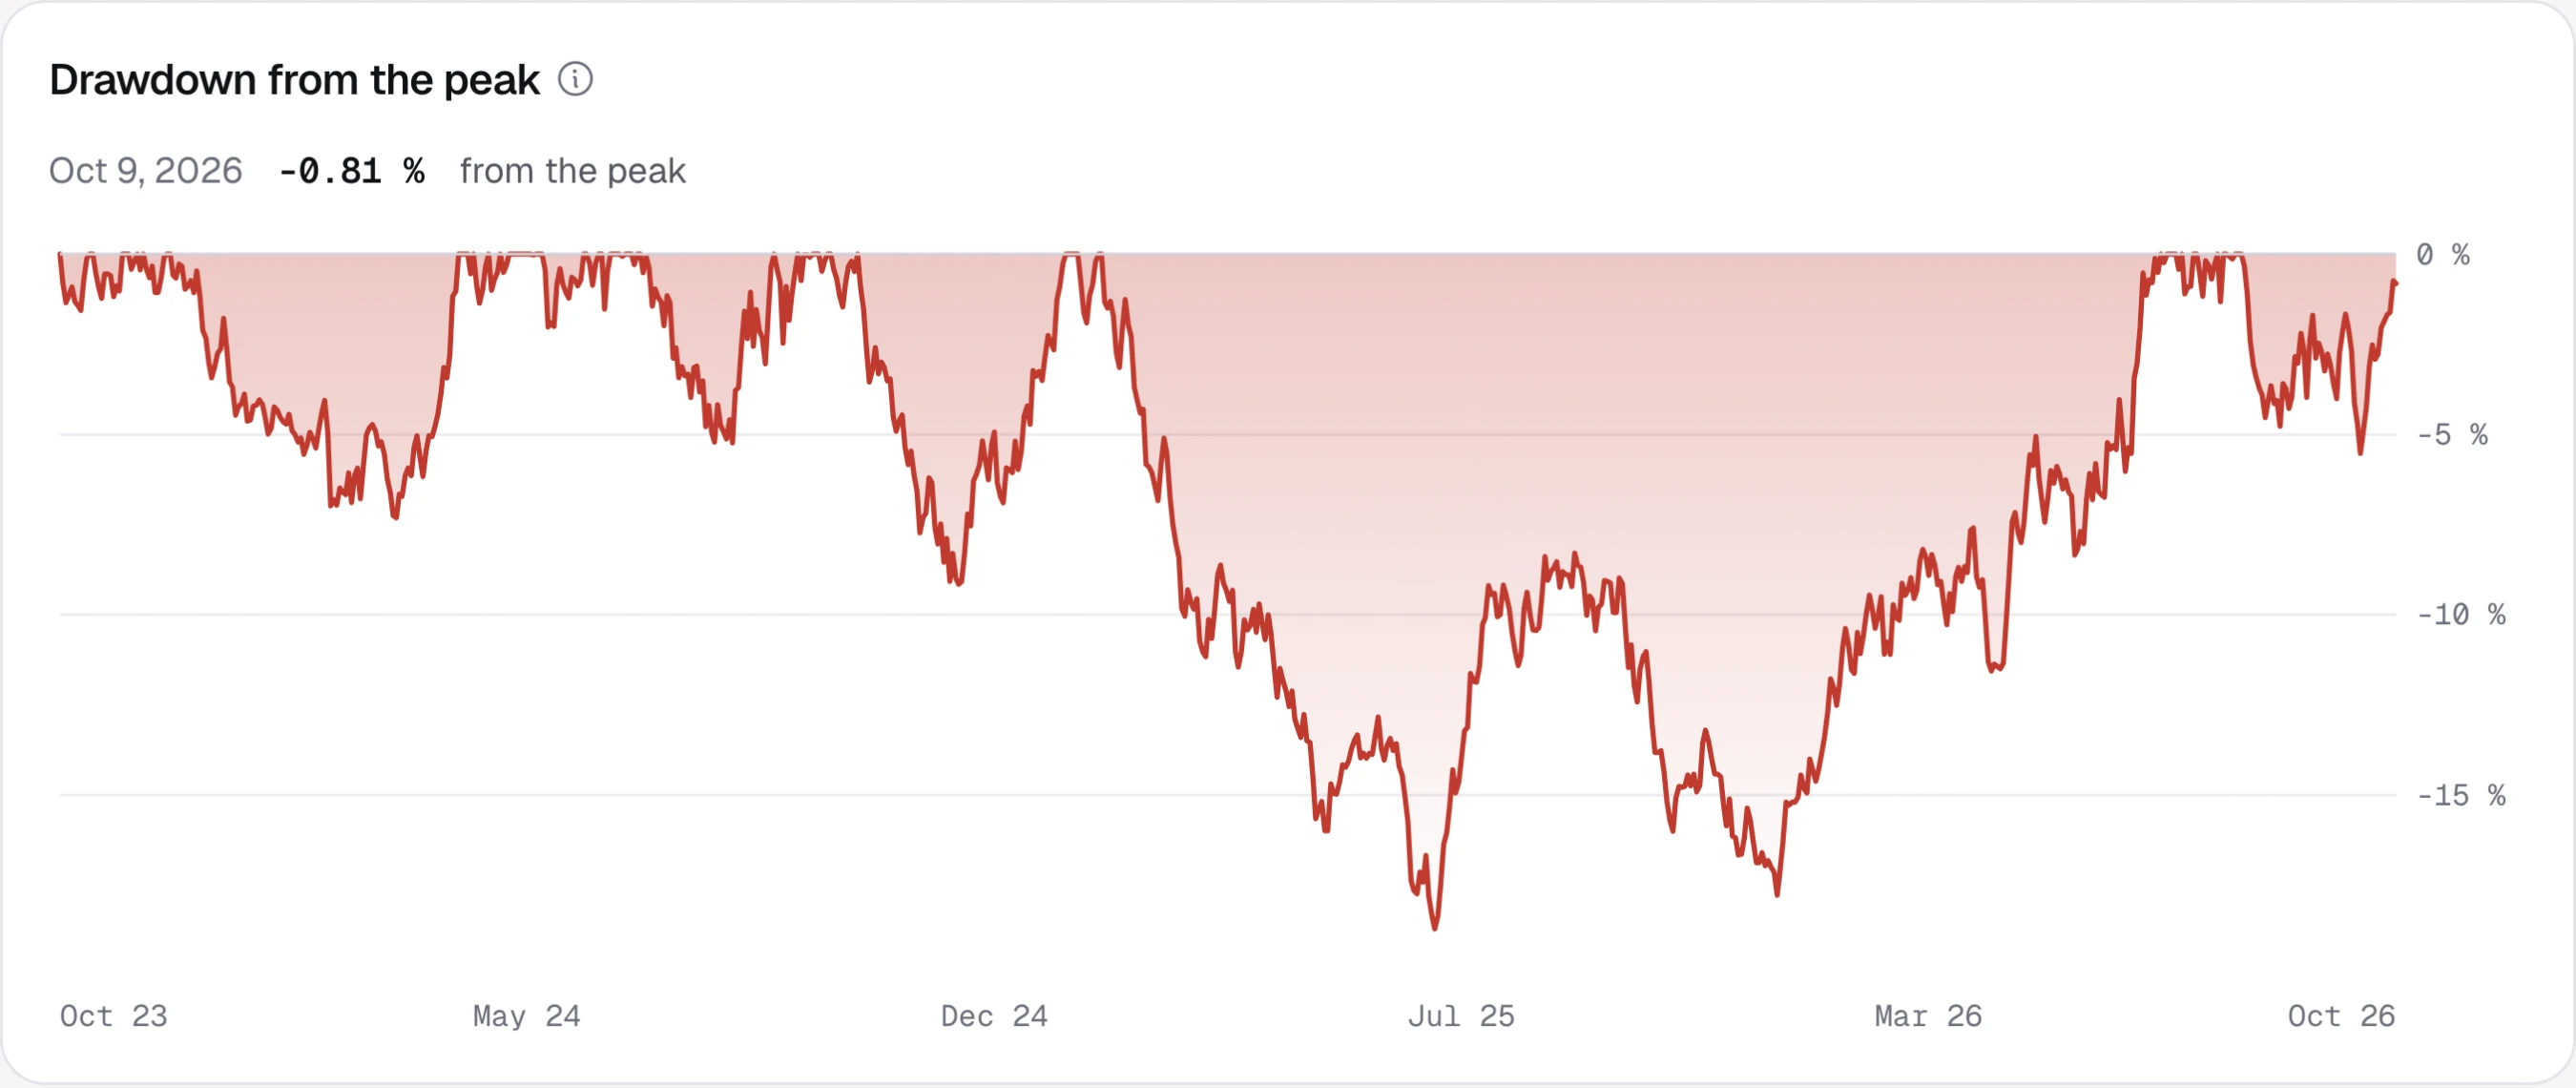
How far the return sat below its last high, day by day. Deposits and withdrawals do not move it, so a top-up never hides a fall.
  • Distance below the last high, every day
  • The deepest drawdowns, listed on the same screen
Drawdown from the peak, October 2023 to October 2026: the return's distance below its last high, deepest at close to −19 % in mid-2025, and −0.81 % on October 9, 2026.

Holdings · Allocation

What is the portfolio made of?

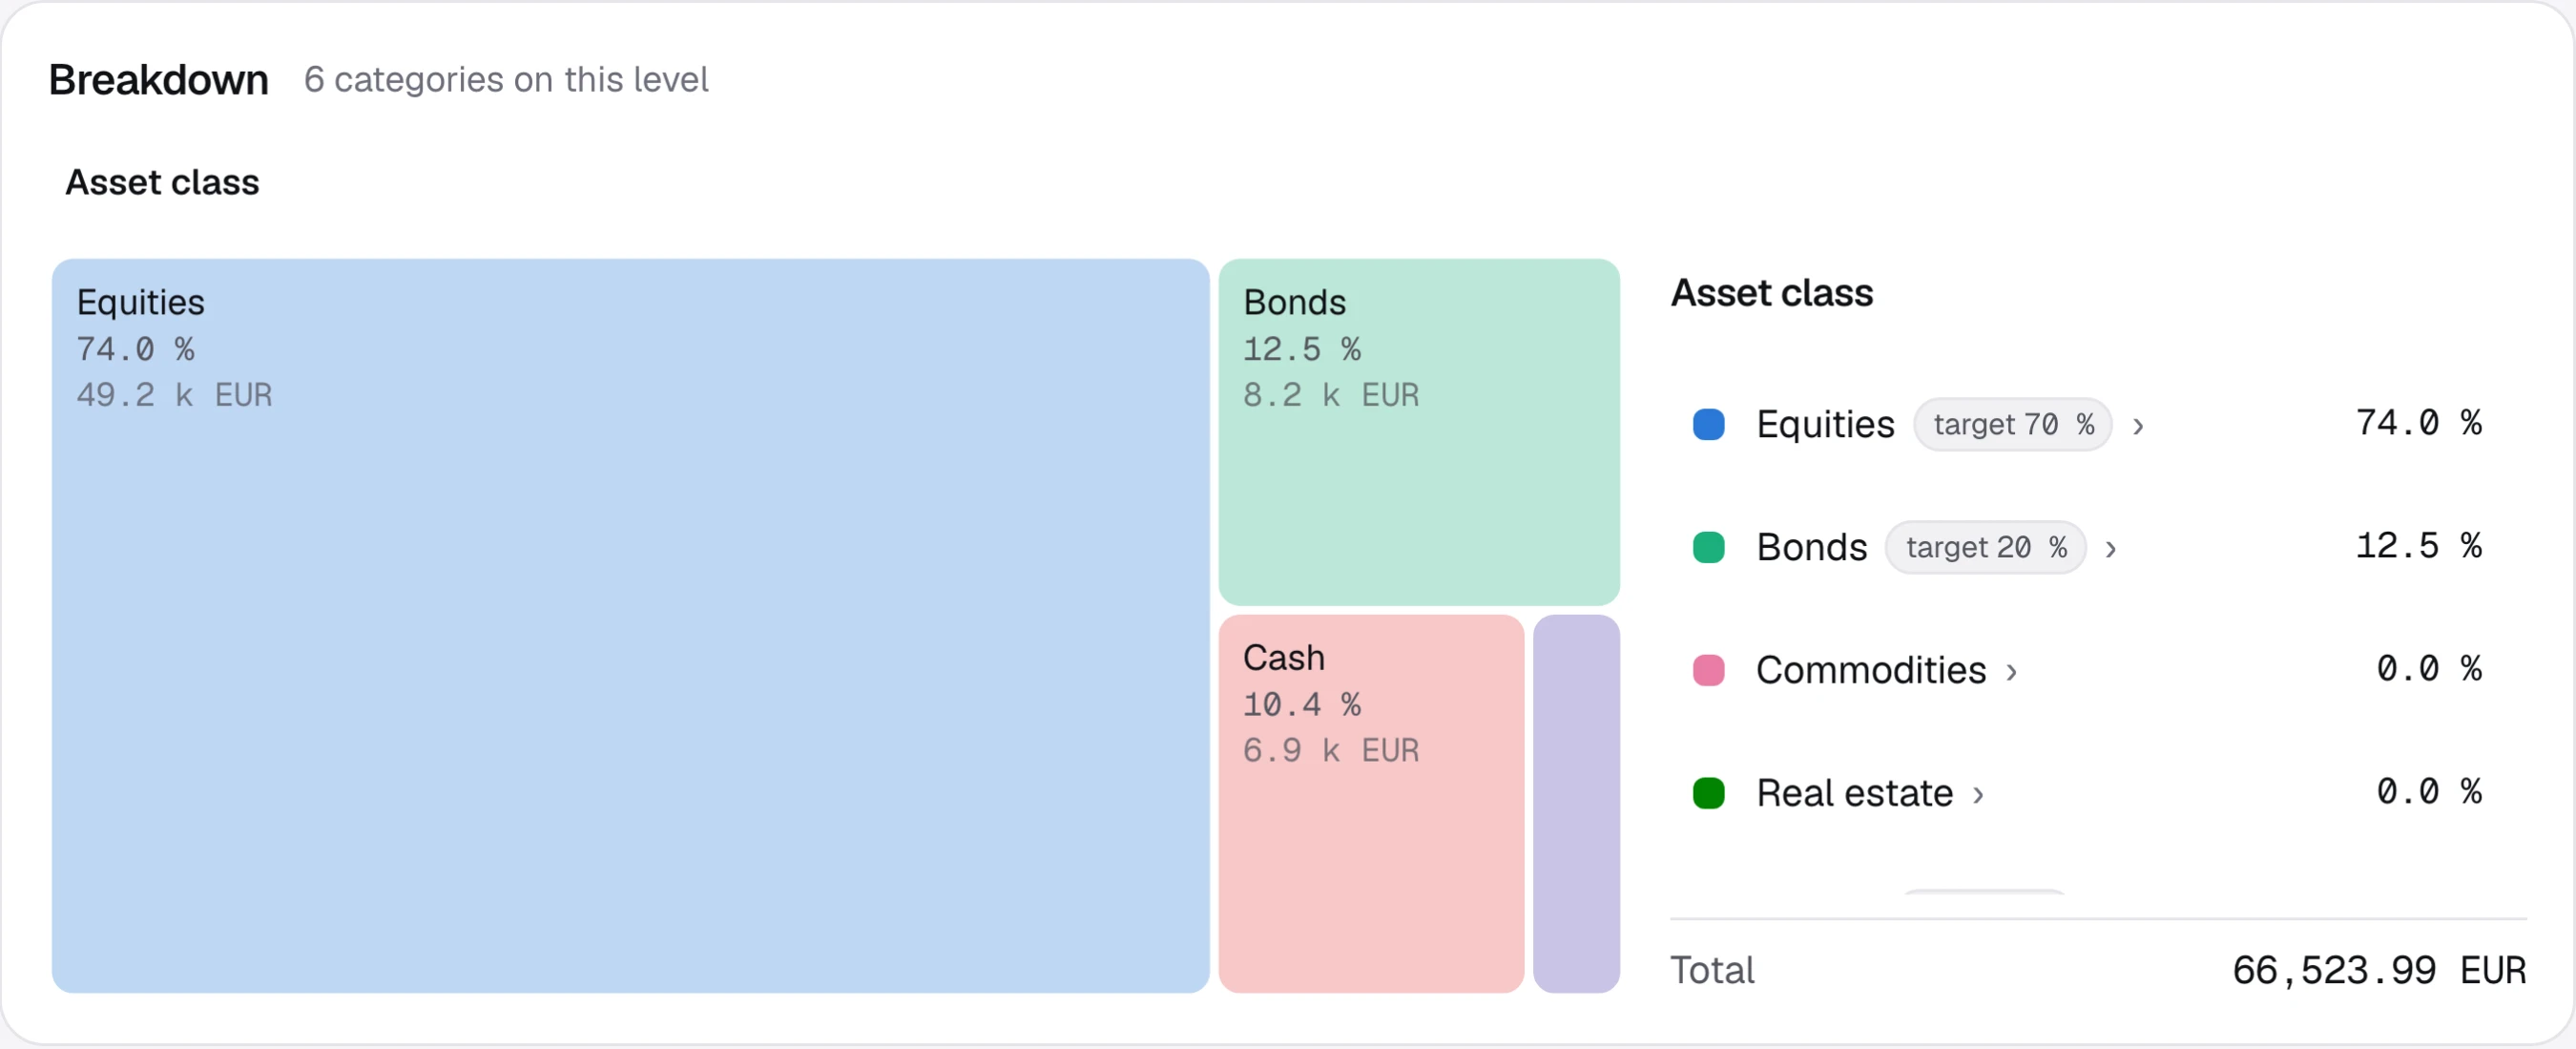
Group your holdings your way. Cash counts like any other holding, and one fund can be split across several categories.
  • Weight and value of every category
  • Your own targets beside them
Allocation by asset class as a map: equities 74.0 %, bonds 12.5 %, cash 10.4 %, with targets of 70 % and 20 % beside equities and bonds.

Holdings · Income

When does the money arrive?

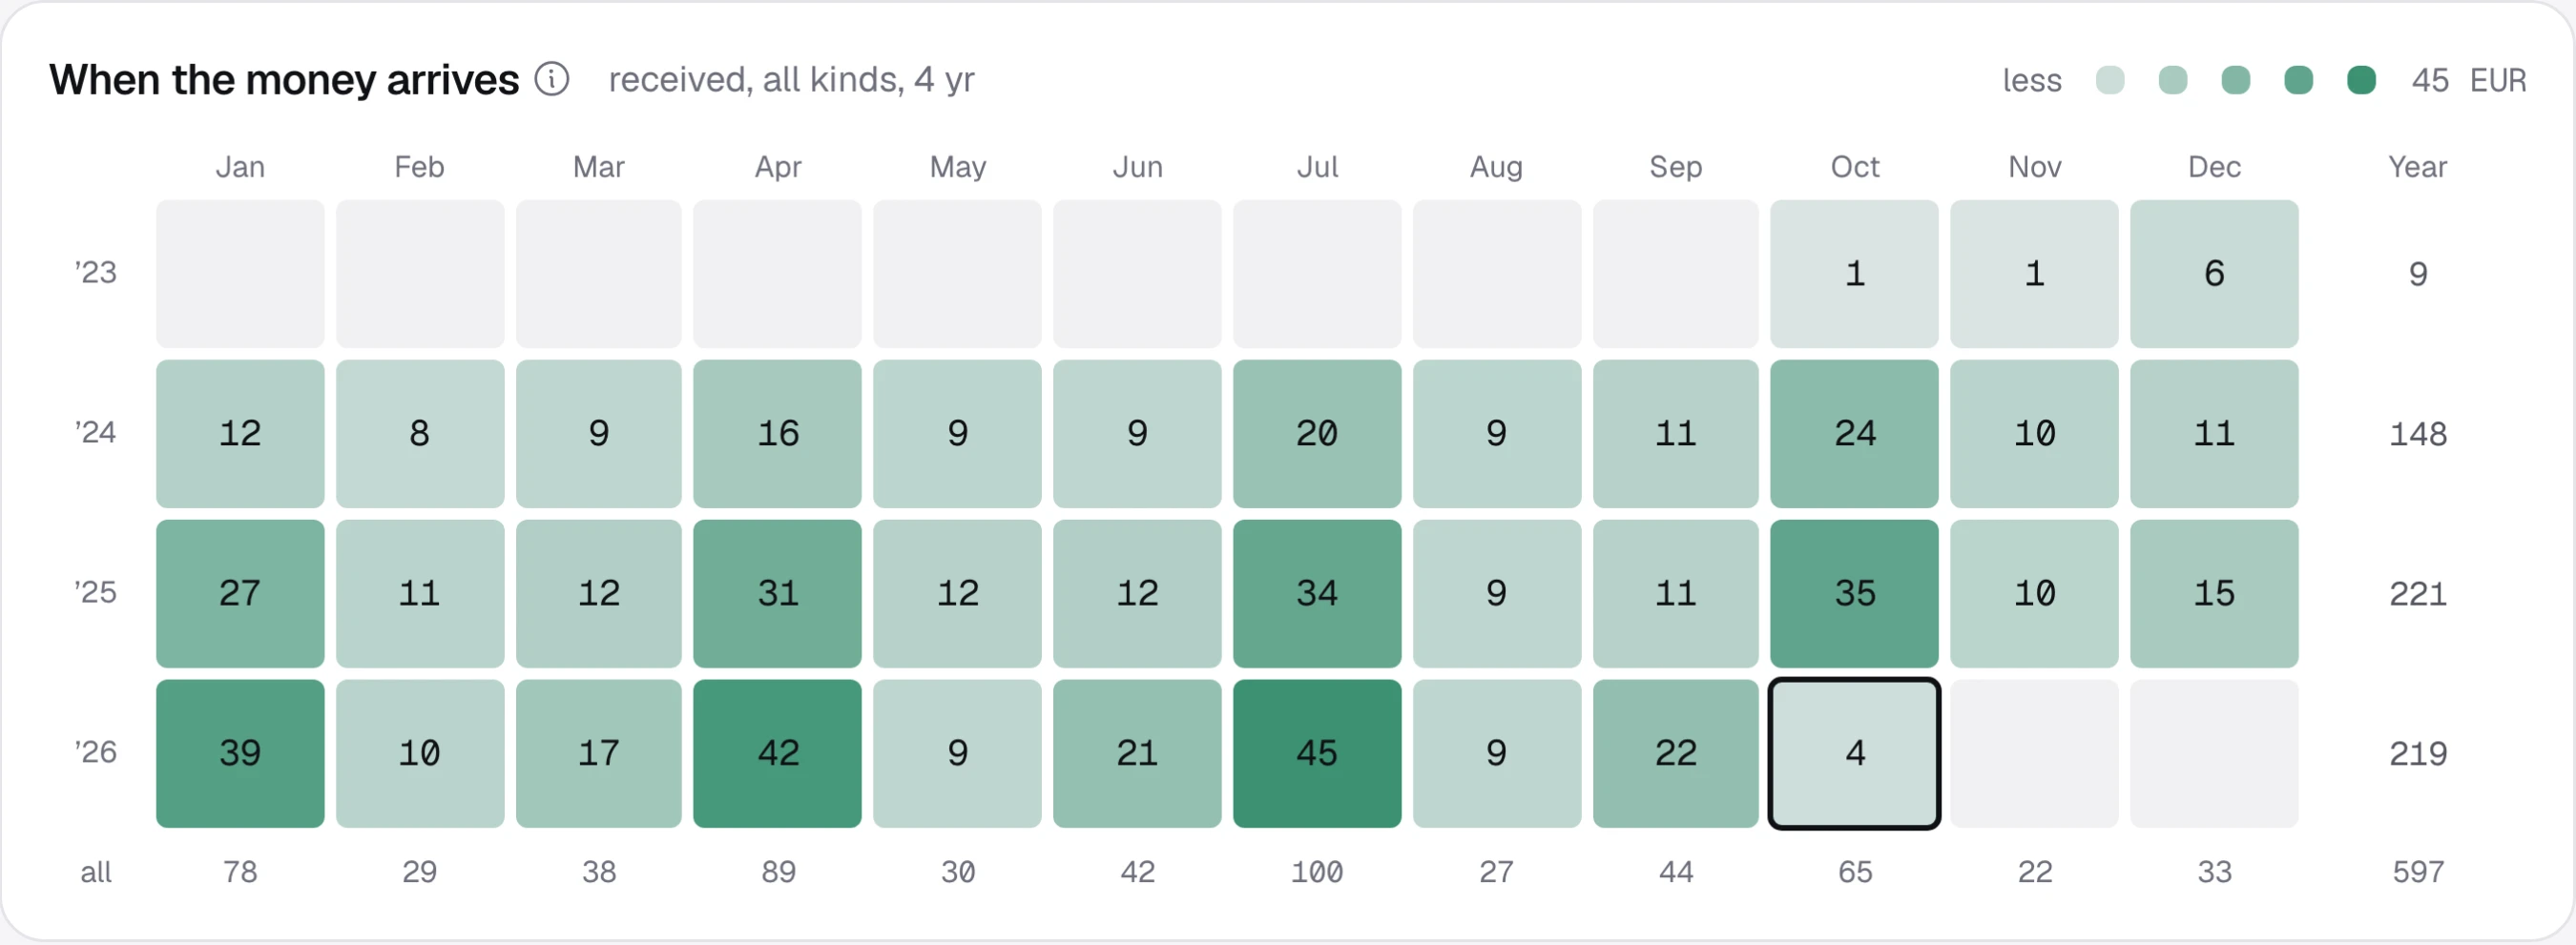
Dividends and interest month by month, with the tax withheld at source kept apart.
  • Income received each month
  • Totals per year and per calendar month
When the money arrives: a grid of income received per month from October 2023 to October 2026, darker where more arrived.

Holdings · Closed trades

What did each sale actually earn?

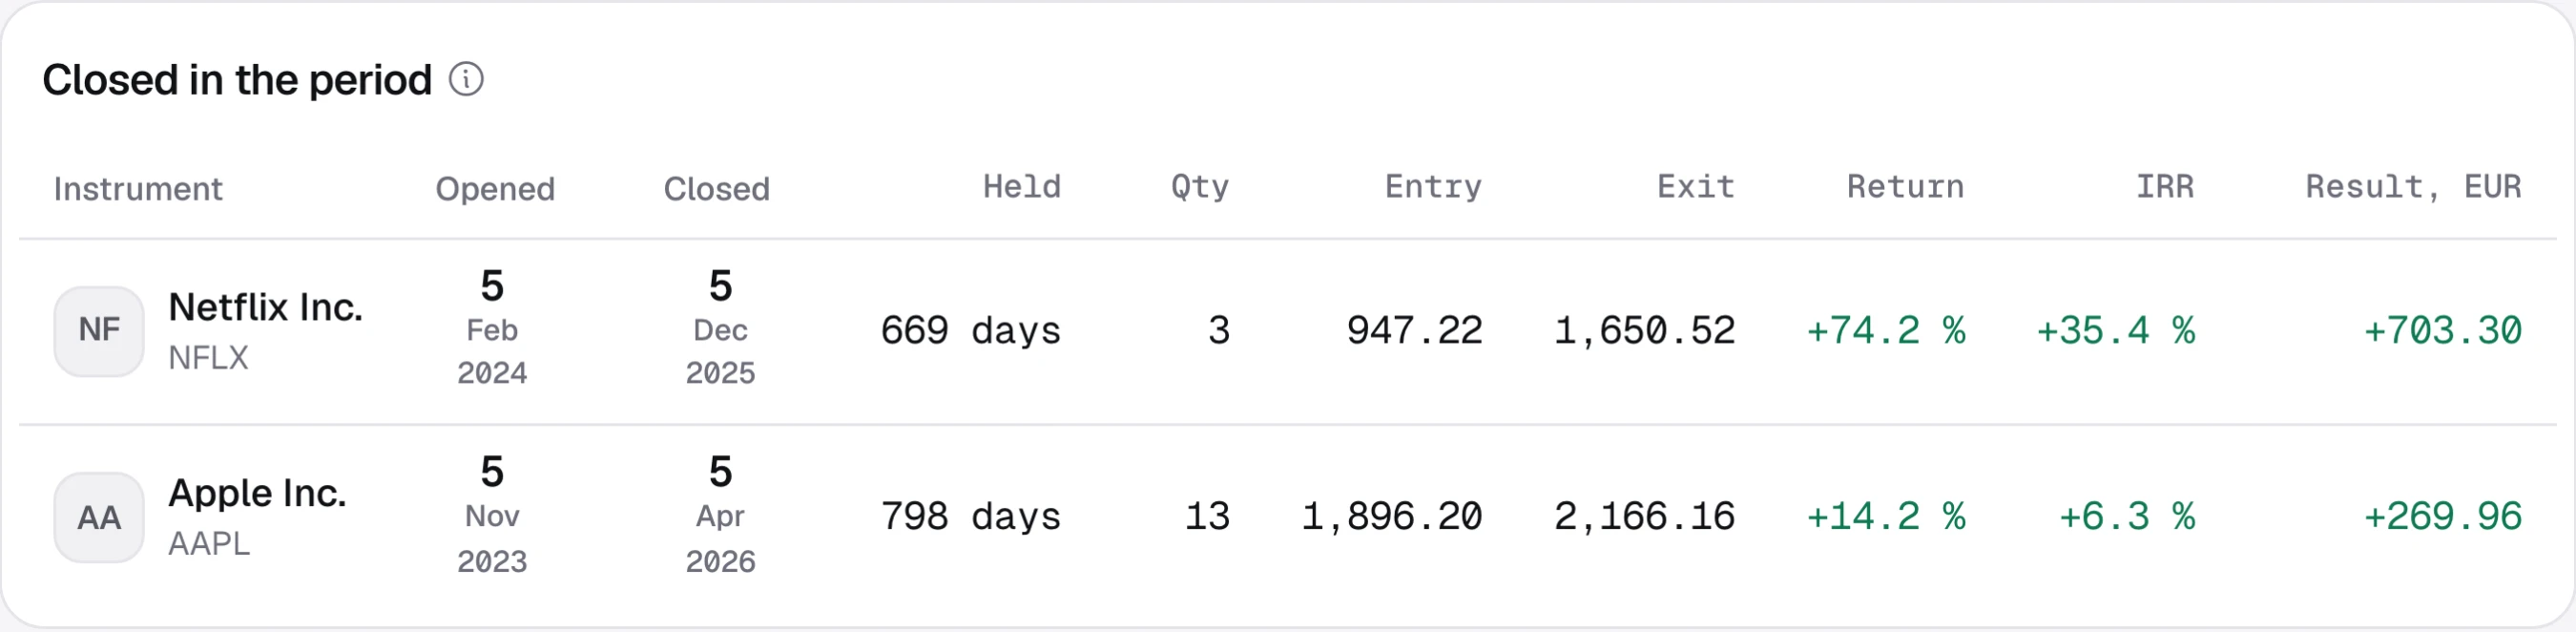
Every trade closed in the period, with its dates and holding time. Entry includes the purchase commission, and exit is net of the sale's fees and tax.
  • Return and IRR of each trade
  • Days held
  • Result after fees
Closed in the period: Netflix, held 669 days, +74.2 % and +703.30; Apple, held 798 days, +14.2 % and +269.96, each with entry, exit and IRR.

Planning · Rebalance

How far is it from your targets?

See how far each part is from its target, and the trades that close the gap, rounded to units you can actually buy.
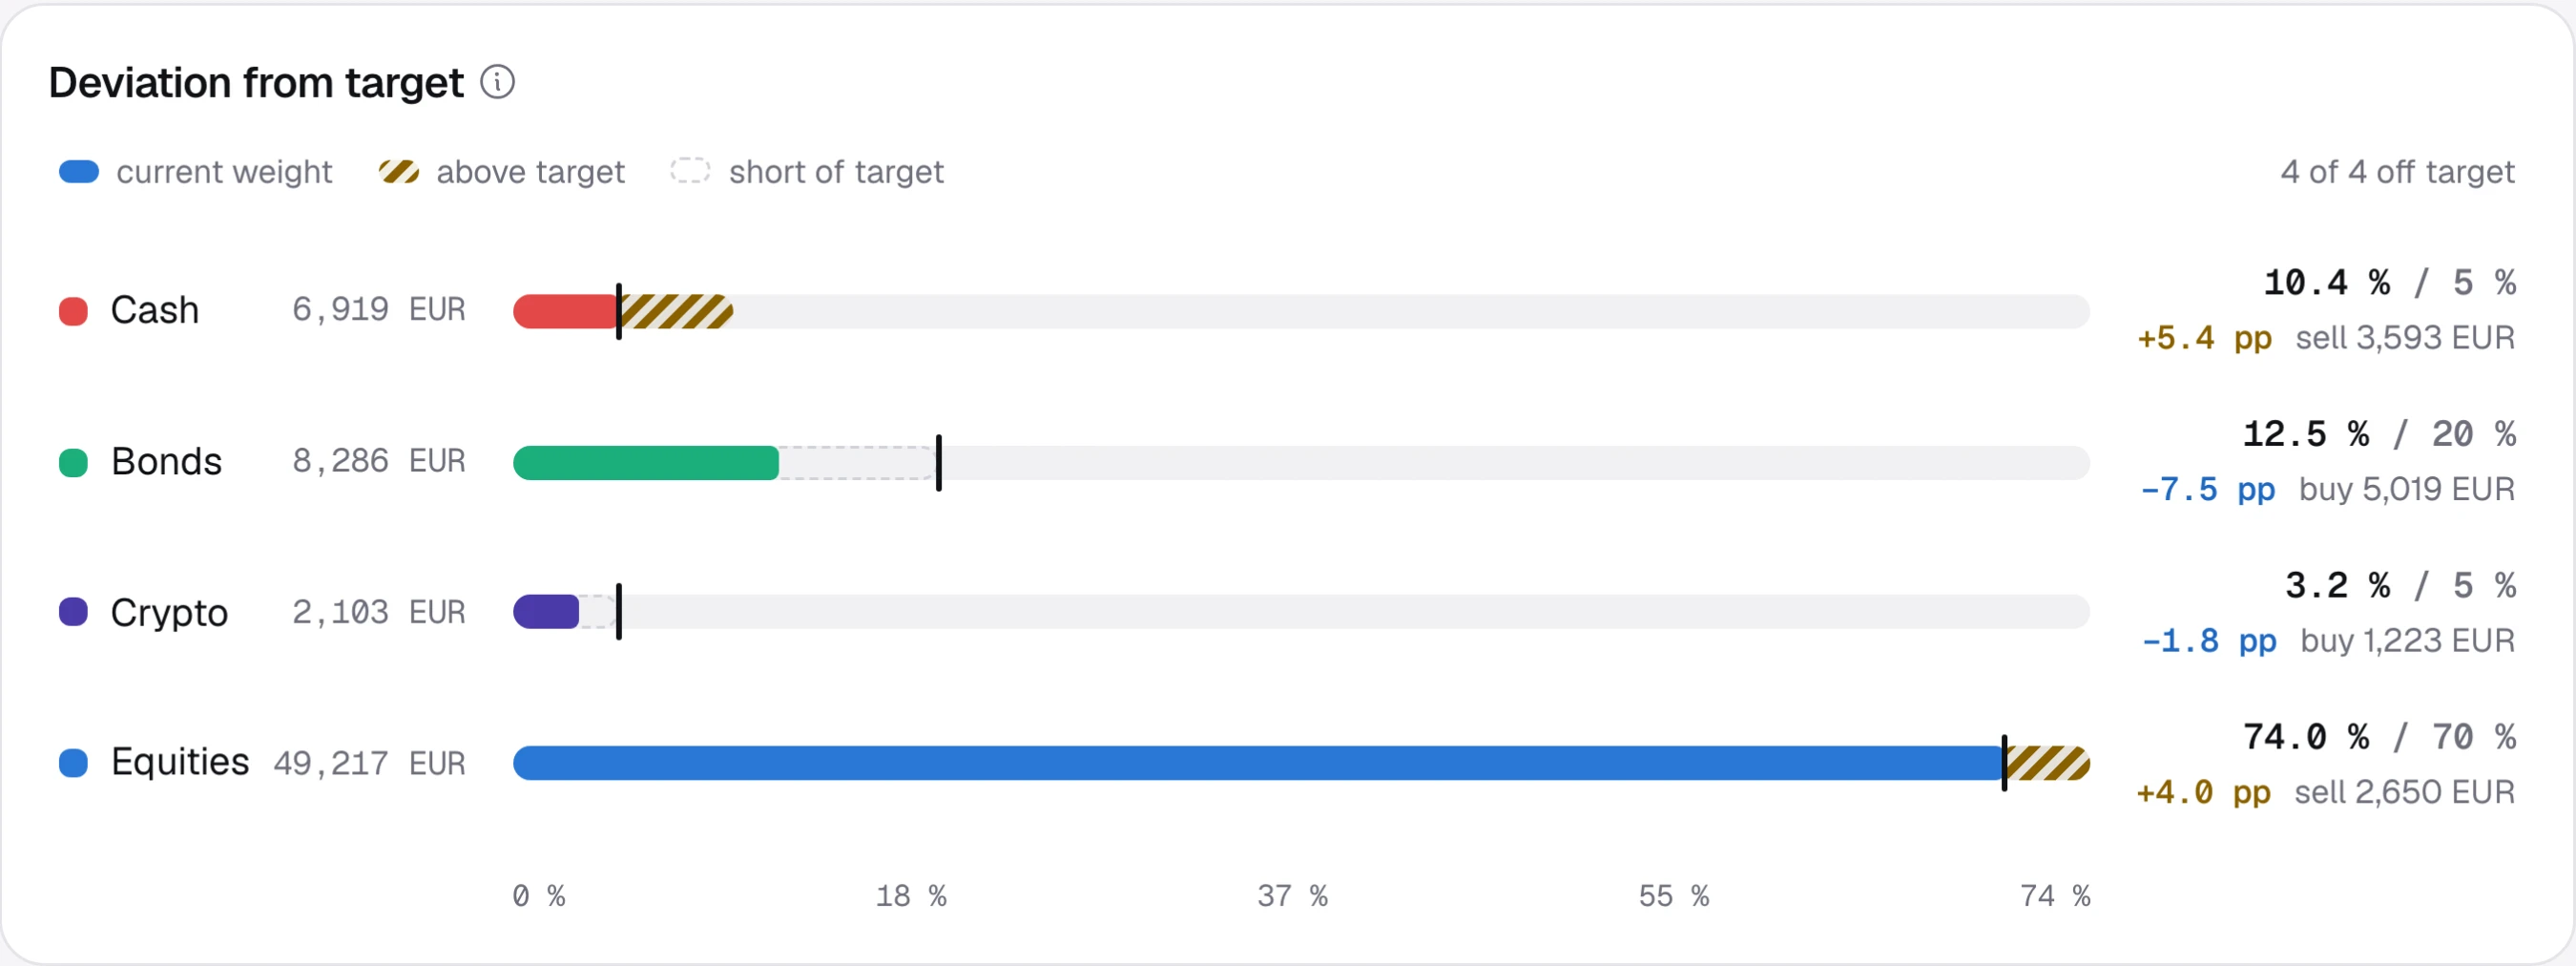
  • Current weight against your target
  • Amount to buy or sell for each part
Deviation from target: cash 10.4 % of 5 %, bonds 12.5 % of 20 %, crypto 3.2 % of 5 %, equities 74.0 % of 70 %, with the amount to buy or sell for each.

Planning · Goals

Will you get there in time?

Goals linked to their own accounts, which tell you whether your current pace gets you there in time.
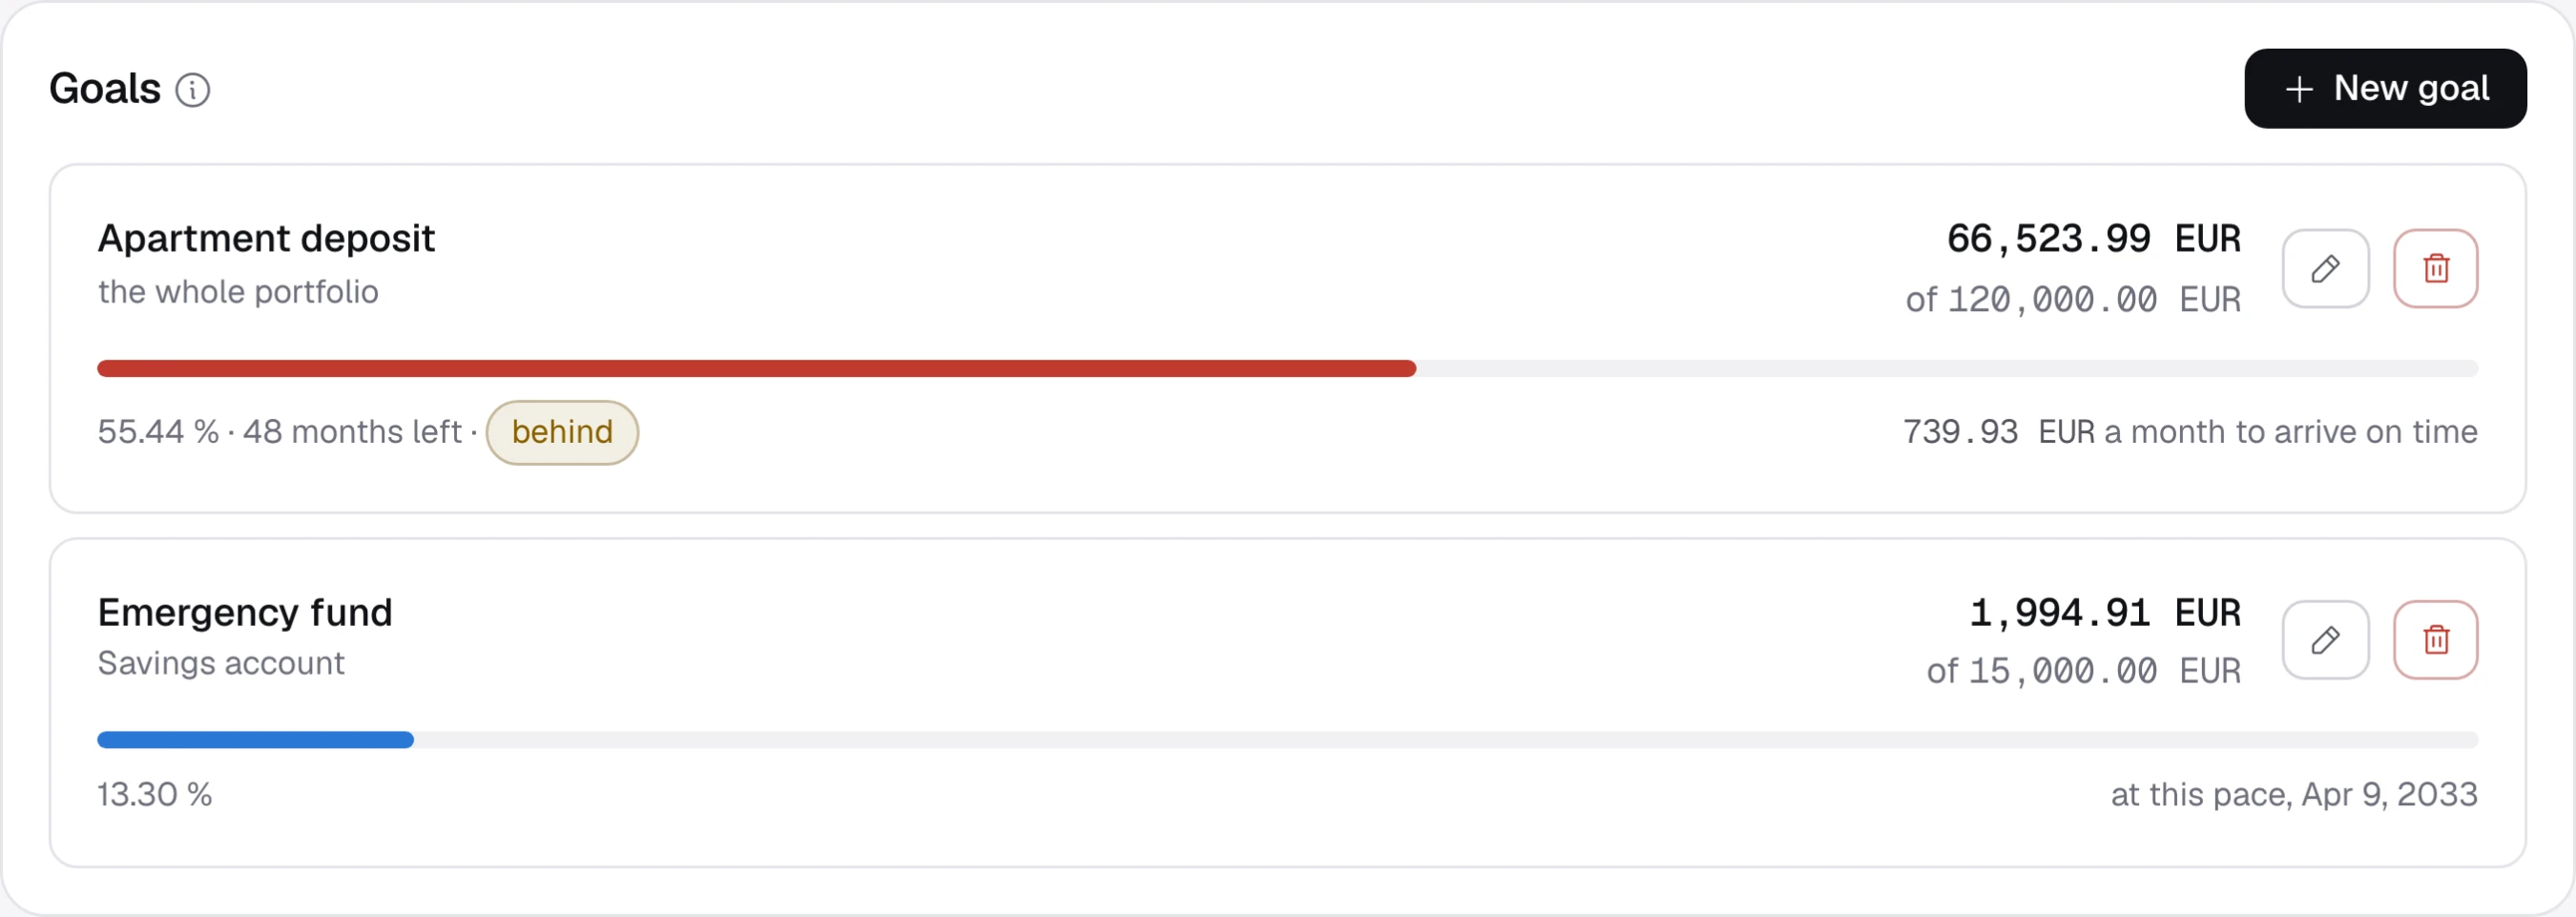
  • Progress towards an amount by a date
  • What a month it takes to arrive on time
Two goals: an apartment deposit at 55.44 % of 120,000 EUR, marked behind, needing 739.93 EUR a month; an emergency fund at 13.30 % of 15,000 EUR.

Everything your spreadsheet stopped doing well.

One ledger, every view.

Positions, trades, risk, income and reports all come from the same transactions. You record each one once.
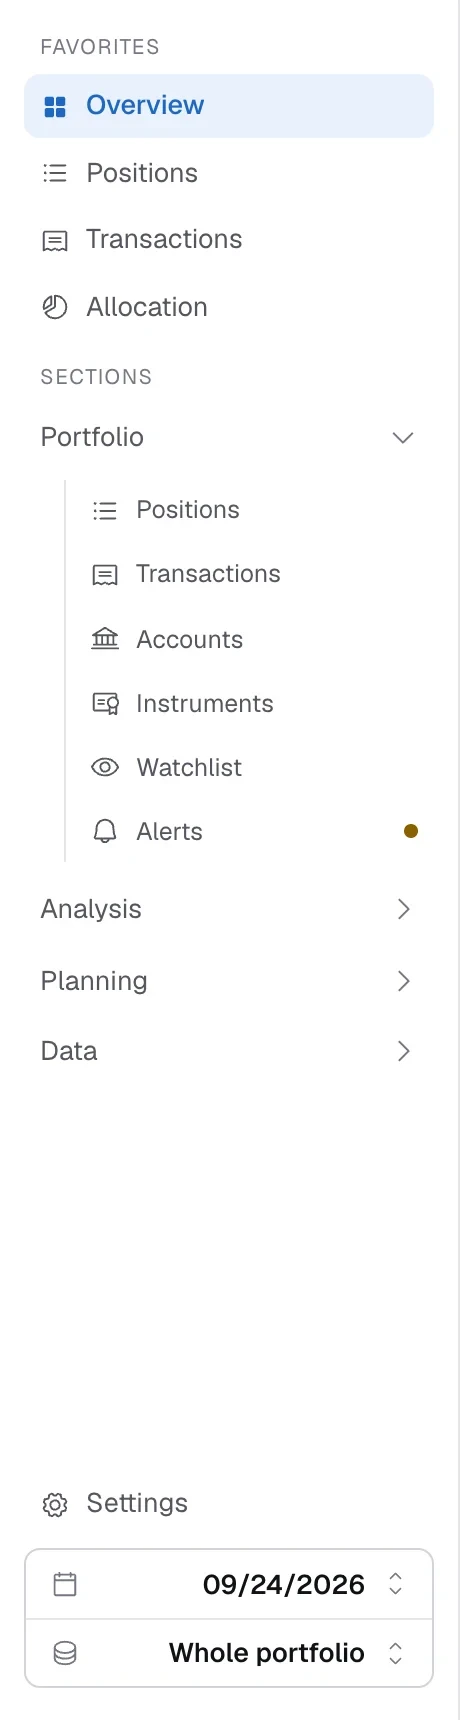
The app's navigation: Overview, Positions, Transactions and Allocation as favourites, then the Portfolio section with Accounts, Instruments, Watchlist and Alerts, and the Analysis, Planning and Data sections.

Any currency, any account.

Every trade keeps the exchange rate of its day, and you see what the currency did separately from what the investment did.

Four figures from the Overview: value 68,138.61 EUR, today +194.27 EUR, time-weighted return +53.37 %, earned over the period +17,795.20 EUR.

Import without the busywork.

Columns, dates and decimal separators are worked out for you, in a dozen languages. You check every row before it's saved, and importing the same file twice changes nothing.

Allocation and rebalancing.

Your own categories and target weights, with suggested trades rounded to what you can buy.

Income and costs.

Dividends and interest by year, yield on cost, payments still to come, and what fees and taxes took.

Plans, goals and alerts.

Savings plans that prepare the month's purchases for you to confirm, goals that track their progress, and alerts when a price crosses your level.

An assistant that asks first.

Ask why your return moved or what fees cost you this year. It answers from your own figures, not from guesswork.

Off until you switch it on

Use your own key for OpenAI, Anthropic, Gemini, or a model running on your own computer.

Asks before it reads

It needs your permission to read your portfolio, once or for the whole chat.

Asks every time before it changes anything

No permission carries over to a change. You approve each one.

Knows the app's own guide

When the guide has no answer, it says so instead of making one up.

What the assistant can and can't do

Your data is a file you own.

No account, no server, no tracking. Your portfolio is a database on your own disk, encrypted if you give the profile a password. Here is every connection the app makes, and when.

When prices are refreshed

Prices
Yahoo Finance, or Twelve Data, EODHD and Kraken if you set them up
Exchange rates
European Central Bank, Frankfurter, Yahoo
Inflation
Eurostat and IMF, only if you pick a region
Instrument lookup
Yahoo and OpenFIGI, when you search

Only when you ask

AI assistant
The provider you chose, with your own key
Update check
GitHub, or the Microsoft Store for a copy from there; once a day, and you can switch it off

Every network request the app makes

Free for macOS, Windows and Linux.

Start with the demo portfolio, then import your own broker export.

macOS

Your system

Apple Silicon is any Mac from late 2020 on. Older Macs are Intel.

On a Mac, Stonqs needs one Terminal command after installing. Without it, macOS reports the app as damaged. How to do it, and why it's safe

All releases and checksumsBuild from source

Your download has started. One more step on macOS

  1. Open the downloaded .dmg and drag Stonqs into the Applications folder.
  2. Open Terminal: press ⌘ Space, type Terminal and press Return.
  3. Paste this command and press Return. If it worked, you'll see no output:
xattr -dr com.apple.quarantine /Applications/Stonqs.app

If it answers “No such file”, Stonqs isn't in Applications yet. Do step 1, then run the command again.